
TL;DR
Your website is full of clues about what’s working and what needs to be fixed, along with thousands of hidden opportunities lying in the data.
Your website is not just a website, it’s where everything comes together. Brand, product, design, UX, content, SEO, AEO, technical performance, messaging, and positioning all live here.
This guide walks you through the basics of B2B website analytics, from why it matters, to what to track, to how to turn those numbers into smarter decisions. If you’re a marketer, this is your new favorite dashboard.
Why website analytics matter for B2B
Your website does more than sit there looking pretty. It’s your round-the-clock teammate helping buyers explore your brand, check out your product, messaging, and content, and decide whether to trust you with their time and money.
In fact, your website should be your number one salesperson. Fully optimised to deliver an experience that attracts the right visitors, builds trust fast, and turns interest into action without ever needing a coffee break.
This has never been more important in B2B, as online sales have never been bigger, and they’re growing incredibly fast. Your website is no longer just a supporting asset. It’s the front door, the pitch, and the closing call all in one.
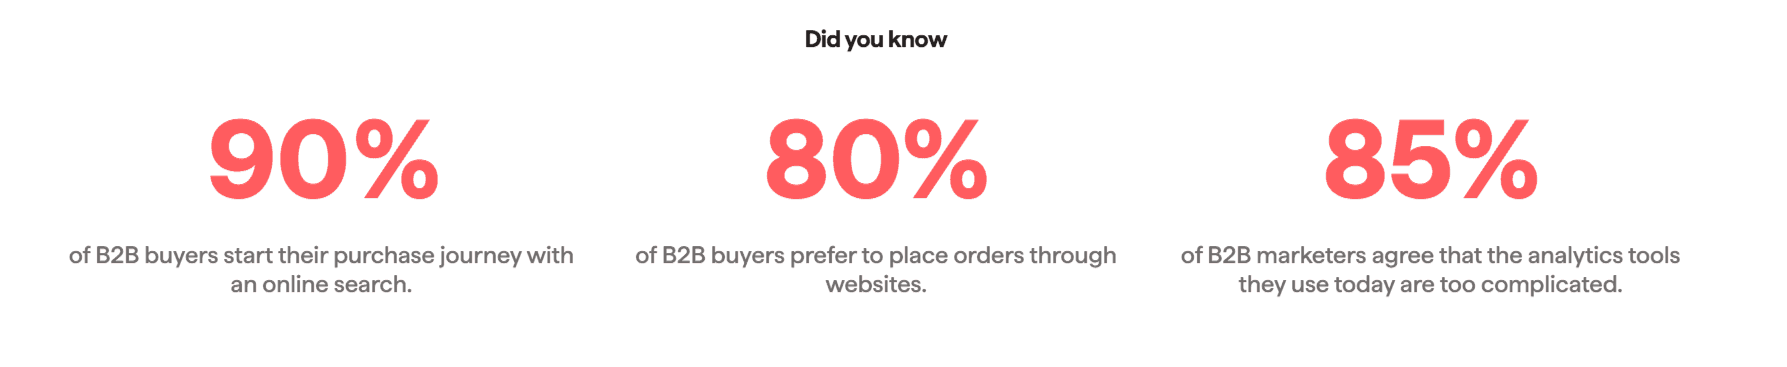
By 2025, 80% of buyer and seller conversations will happen online. Right now, 90% of B2B buyers start their journey with a search, 80% prefer placing orders on websites, and 90% check out between 2 and 7 sites before deciding who to talk to.
That means your site is the first impression, the pitch, and the deal closer all in one.
With proper website analytics, you can see whether your site is actually designed to attract, engage, and convert the right visitors or is just hoping for the best.
You’ll spot which pages bring in high-intent traffic, which ones keep people scrolling, and which ones send them running for the exit.
You’ll see if anything is technically off, understand how visitors are behaving on your site, what they like, what they don’t, where they get stuck in the journey.
Whether your site is being found in search & answer engines, if your content and pages are engaging, and ultimately whether your website is built to create excitement, build trust and help people take action.

What is website analytics?
Website analytics is simply watching what visitors do on your site and understanding why they do it. The basics include sessions, traffic sources, clicks, conversions, and user behavior, but that’s just the starting point. The real power comes from connecting the dots.
Are the right people finding your site through search? Are they sticking around and exploring your content? Are they clicking the buttons you want them to click or bouncing after five seconds? Website analytics helps you answer those questions and more.
It shows you how people move through your site, where they get stuck, which pages hold their attention, and which ones quietly kill conversions. You can see if your calls to action are working, if your forms are causing drop off, or if your site is fast enough to keep mobile users engaged.
When used well, analytics gives you a full view of whether your website is actually doing its job, helping people discover your business, trust what they see, and take action.
Here's the 4 steps we recommend:
Measurement: Track every visit, every click, every path so you don’t miss anything.
Interpretation: Connect the numbers to real business goals like demo requests, guide downloads, or purchases.
Recommendation: Use those insights to spot what’s broken, what opportunities are hidden in the data, and know what issues to fix and what opportunities to capitalise on first.
Action: Continuously optimise the website based on insights & recommendations. Make the changes. Run the tests. Improve the experience. Turn insights into real results.
What to track (and why it’s worth it)
These are the numbers that tell you whether your website is doing its job, attracting the right visitors, keeping them engaged, and turning interest into action.
Discovery metrics
Organic search Traffic from people who found you through search engines like Google or from answer engines like ChatGPT. A strong signal of both SEO and AEO performance.
Paid search Traffic from search ads such as Google ads, Linkedin, Facebook, and Instagram ads. Use this to measure campaign ROI and compare it to organic.
Referral traffic Visitors coming from other websites, think partners, guest blogs, or listings.
Direct traffic Visitors typing your URL directly or using a saved bookmark.
Organic social Traffic from LinkedIn, Twitter, and other social channels.
Email Traffic from newsletters, lead-nurturing campaigns, or announcements.

Engagement metrics
Sessions and unique users Sessions show how often your site is visited. Unique users tell you how many different people are actually showing up. If sessions go up but users stay flat, you might just be recycling the same traffic.
Total visits Your overall traffic count. Good for tracking the impact of campaigns, content drops, or SEO improvements.
Engagement rate This is the share of sessions where people do something useful, click, scroll, watch a video, or read multiple pages. A 40% rate or higher is a strong sign of interest.
Session duration How long someone stays on your site per visit. Two minutes or more is great. Under 30 seconds? Time to find the friction.
Pages per session How deep people go. Are they reading more than one page or bouncing straight out? More pages usually mean more intent.
Page views The total number of pages viewed. Helps you see which content is being consumed the most.
Top landing pages These are your entry points—the first pages people land on from search, ads, or emails. Make sure they’re fast, clear, and designed to guide the next step.

Conversion metrics
Conversions This is any action that matters to your business—a demo request, a form fill, a whitepaper download.
Conversion rate The holy grail of website metrics. The percentage of visitors who convert. For B2B, 2% is decent, but with optimisation, you can push past 5% and way beyond!
Form start vs form completion If people start your form but don’t finish it, that’s a red flag. Shorten it or improve clarity to boost completions.

Technical performance metrics
Page load times Slow pages kill conversions. Aim for under 3 seconds, especially on mobile.
Server uptime If your site is down, your pipeline is too. Target 99.9% uptime or higher.
Error rates Broken pages, failed scripts, or missing content quietly sabotage the user experience. Keep an eye on errors and fix them fast.
What good is data if you don't do anything with it?
Spot trouble before it snowballs
Set up alerts for sudden dips in traffic, demo requests, or engagement. That way, you’ll catch problems as they happen, not after they’ve quietly tanked your pipeline for a week.
Fix the stuff that’s costing you leads
Start with the pages that get visitors but don’t convert. Maybe your headline is too vague, your CTA is buried, or the layout feels clunky. Tweak what’s broken and watch what happens.
Let the AI do the heavy lifting
Automate your weekly reports. Get instant insights on what’s working, what’s not, and what to do next. Instead of digging through dashboards, you get clear recommendations on how to improve your site, boost conversions, and fix issues before they become a problem.
Best practices for getting it right
Don’t track everything, just what matters
Stick to 5 to 7 core metrics. That’s more than enough to understand what’s going on and where to focus. The goal is clarity, not chaos.
Make it a weekly habit
Set aside 30 minutes each week to check your insights, spot trends, and choose one or two things to improve. You’ll stay ahead without getting buried in data.
Get the whole team on the same page
Marketing, sales, product, and everyone should be working from the same numbers. One shared dashboard. One shared truth.
Make small changes often
You don’t need a full redesign to see results. Try one tweak at a time, a headline, a button, a form step, then measure what happens and keep what works.
Let smart tools do the legwork
No need to pull reports or guess what to fix. Use AI-powered insights to surface what’s working, flag what’s not, and suggest your next best move. Less guesswork, more progress.

Conclusion and next steps
Your website has a job to do, and now you know exactly how to track whether it's doing it well. With the right analytics setup, you can see what’s working, what’s not, and where the real opportunities are hiding.
From traffic sources and engagement to conversion rates and technical performance, every insight is a chance to optimise, improve, and grow.
Ready to see it in action?
Check out www.optise.com and try our free trial. Run your B2B website through AI-powered website analytics and get instant insights into what’s working, what’s not, and exactly what to do next.
No guessing. No fluff. Just smarter decisions that drive more leads and revenue.
FAQ
What is website analytics for B2B?
Website analytics for B2B is the process of tracking how business visitors find your site, interact with it, and take meaningful actions like booking a demo or downloading a resource. It helps you understand performance, uncover problems, and improve results.
Which website analytics metrics should B2B marketers track?
Focus on sessions, unique visitors, engagement rate, traffic sources, time on page, conversion rat,e and top landing pages. These show how well your site is attracting, engaging, and converting the right audience.
How often should you review your website analytics?
Check your analytics weekly to stay on top of trends and catch issues early. Do a deeper review monthly to find patterns and plan updates.
What is the difference between analytics tools and platforms?
Analytics tools track specific behaviors like clicks or scrolls. Full platforms give you the complete picture with traffic data, engagement insights, conversion tracking, and AI-powered recommendations.
Can AI website analytics replace Google Analytics?
Not replace but absolutely enhance. Use Google Analytics for core tracking and let AI analytics recommend what to fix, where to improve and how to grow faster.
How does website analytics improve B2B site performance?
It shows what is working and what is not, from slow pages and bounce rates to top-performing content. With the right insights, you can optimise user experience and turn more visits into qualified leads.
Where does Answer Engine Optimisation AEO show up in analytics?
AEO shows up as part of organic search traffic. You can track its impact by monitoring featured snippet visibility, structured data, and how often your content appears for question-based queries.

Ómar Thor Ómarsson
CEO & Co-founder